Ing’s Peace Project
And
Open Doors Party at the Newark Museum
Music by Steeve Sam, Janine Salinas and Andy Plants
On Friday, October 10, 2014
Part 3
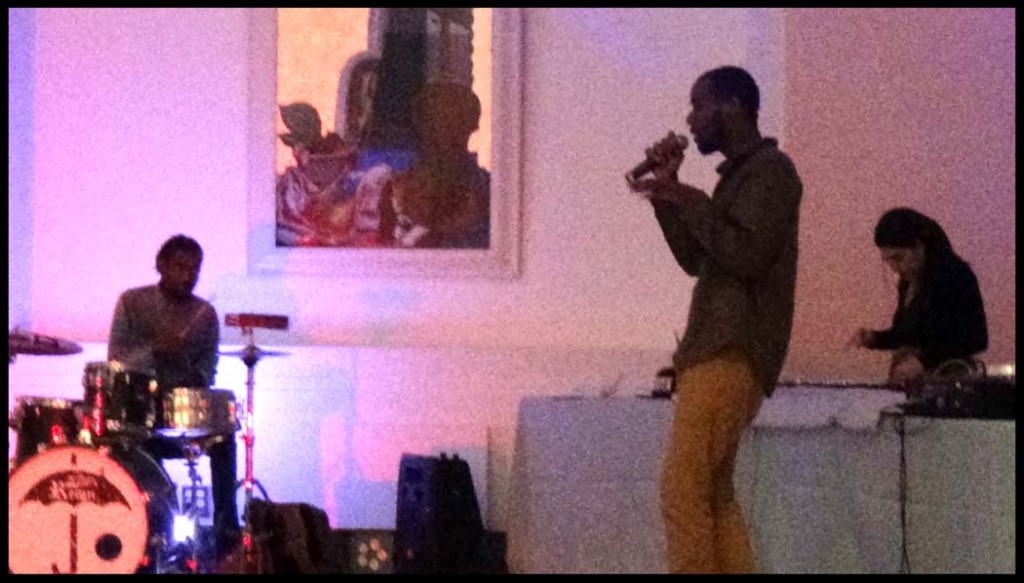
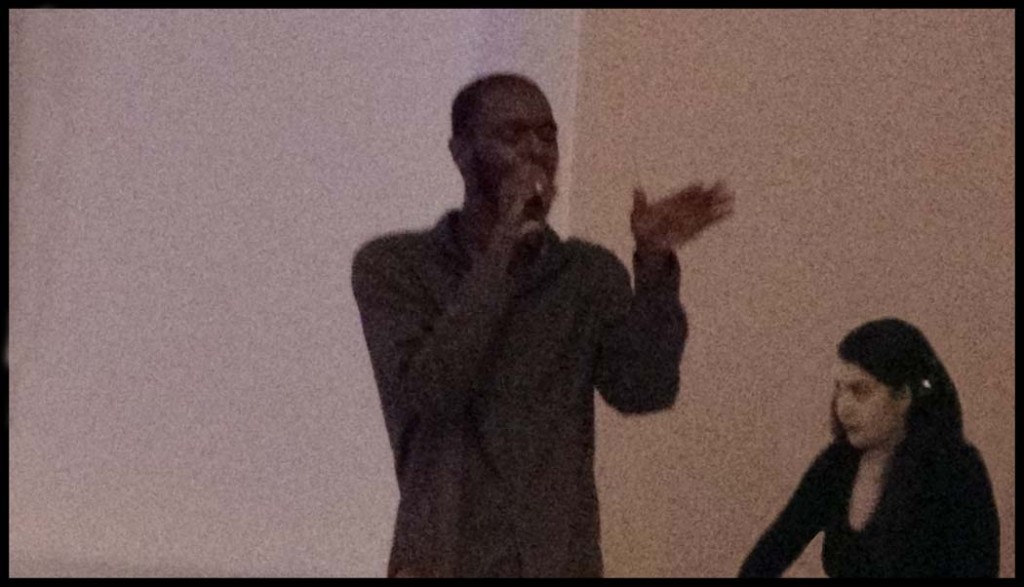
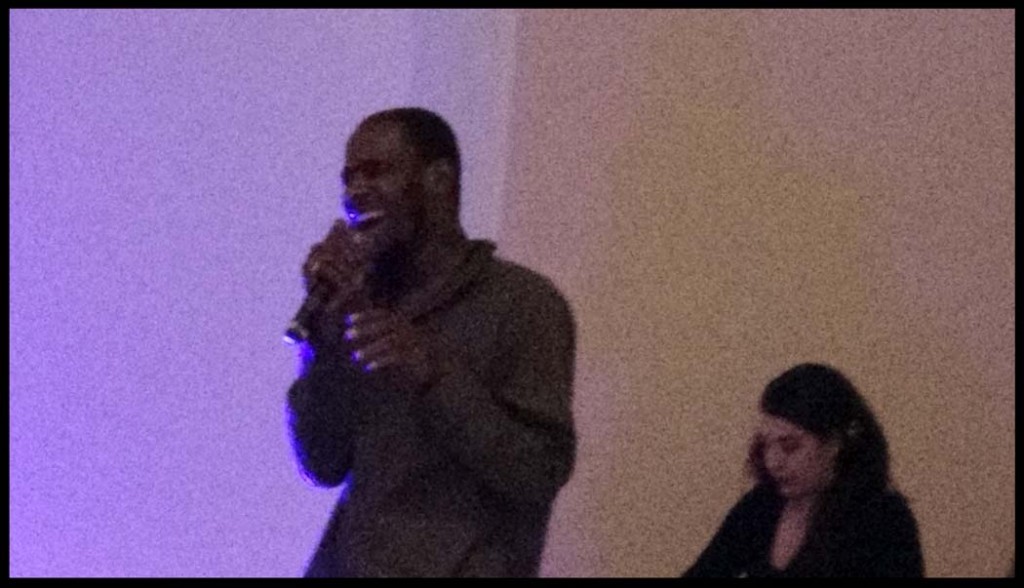
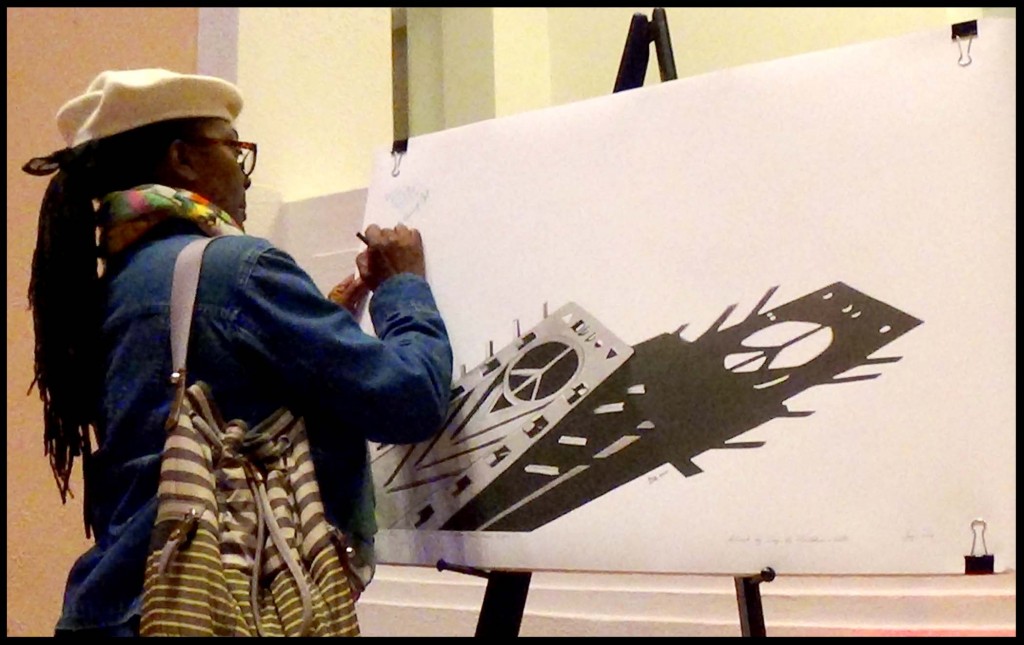
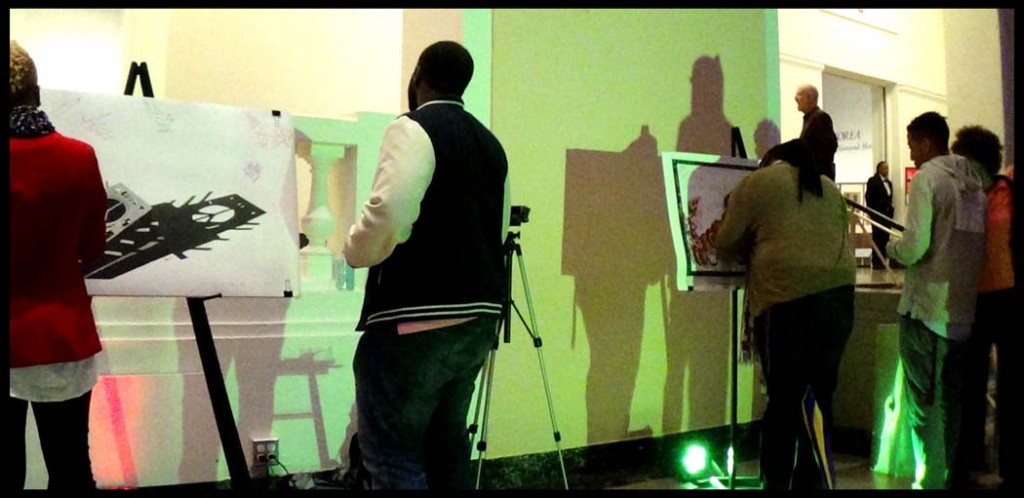
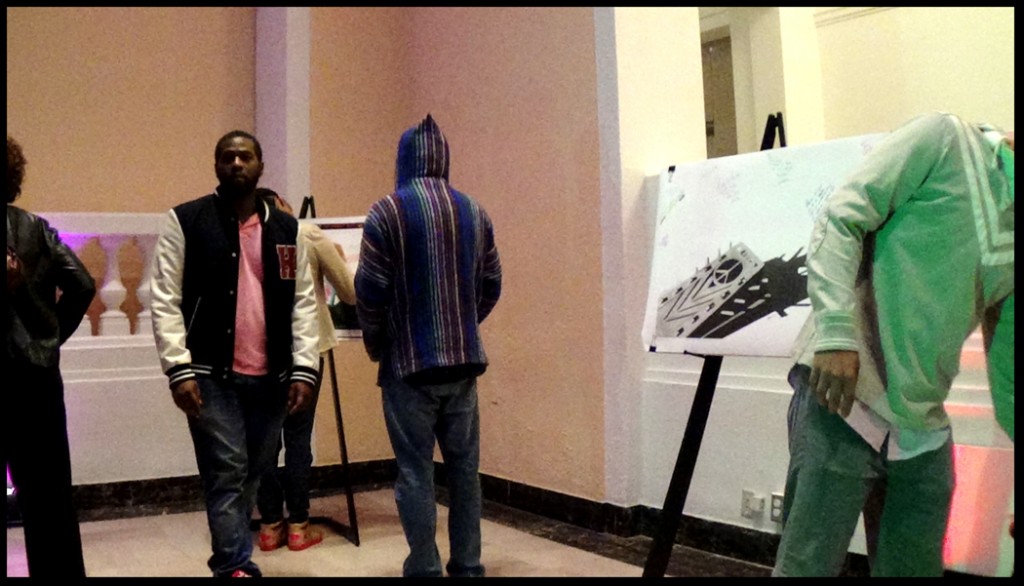
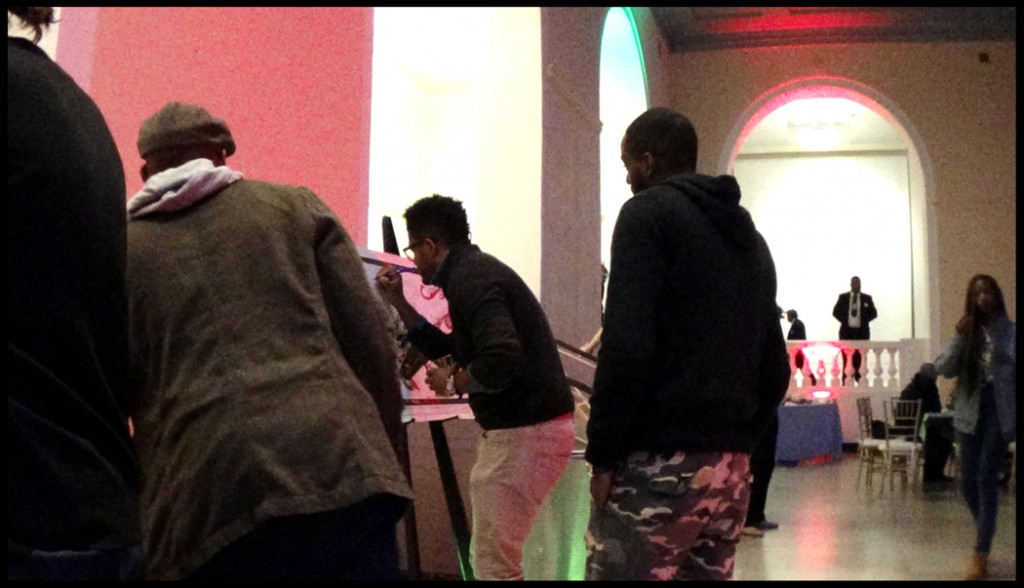
Open Doors Party at the Newark Museum on Friday, October 10, 2014 at 5 – 9 PM. There were drinks and dancing to the sounds of Djs Janine Salinas, Andy Plants, and the drummer is Rocky with Steeve Sam as the host.
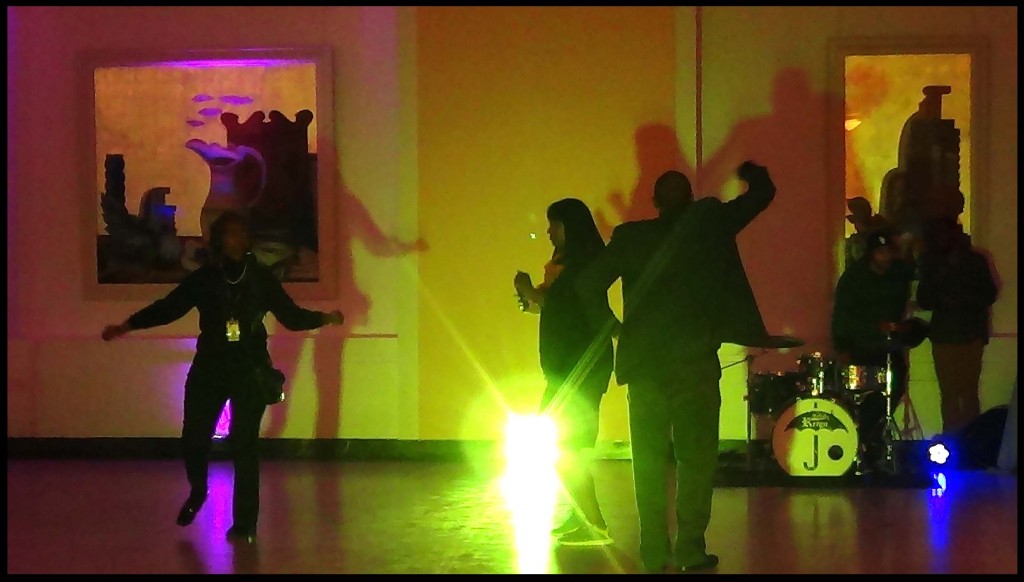
I am grateful and appreciate Steeve Sam and Janine Salinas who invited me to present my peace project with the event. Everyone enjoyed the music with rhythms that encouraged people to step on the dance floor presenting their fancy movements being altogether in an atmosphere of happiness and joy.
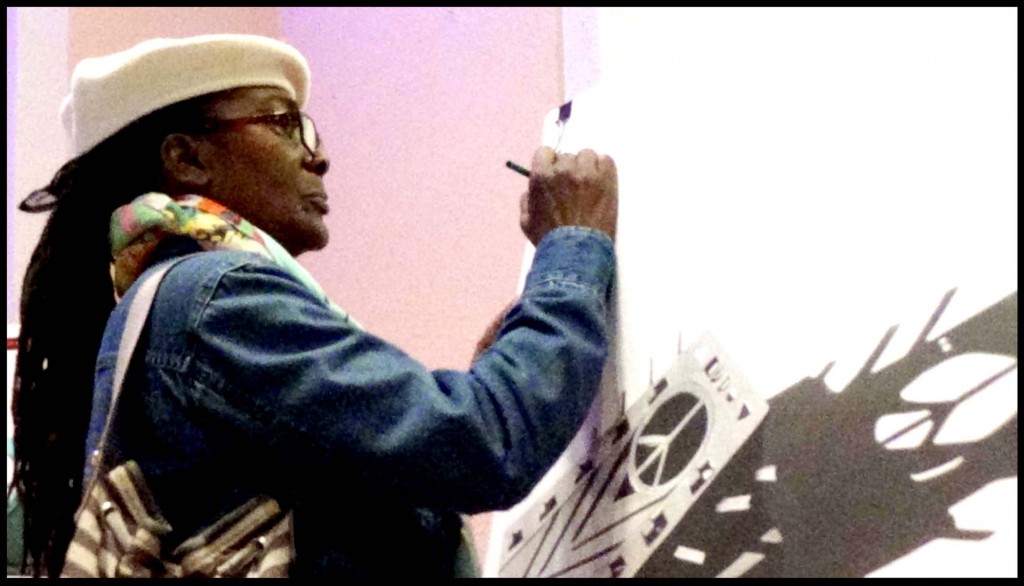
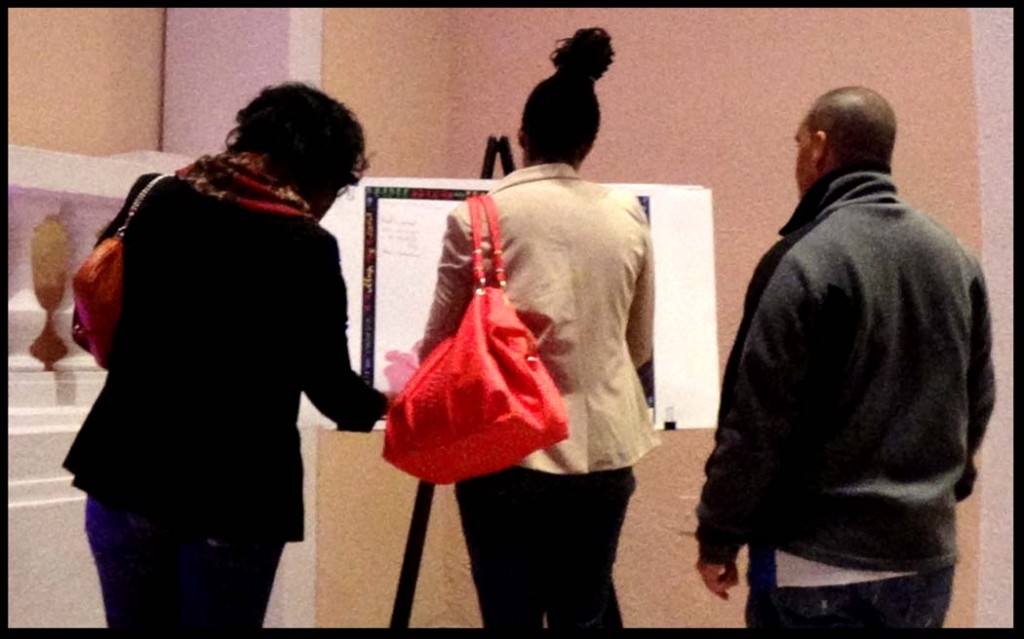
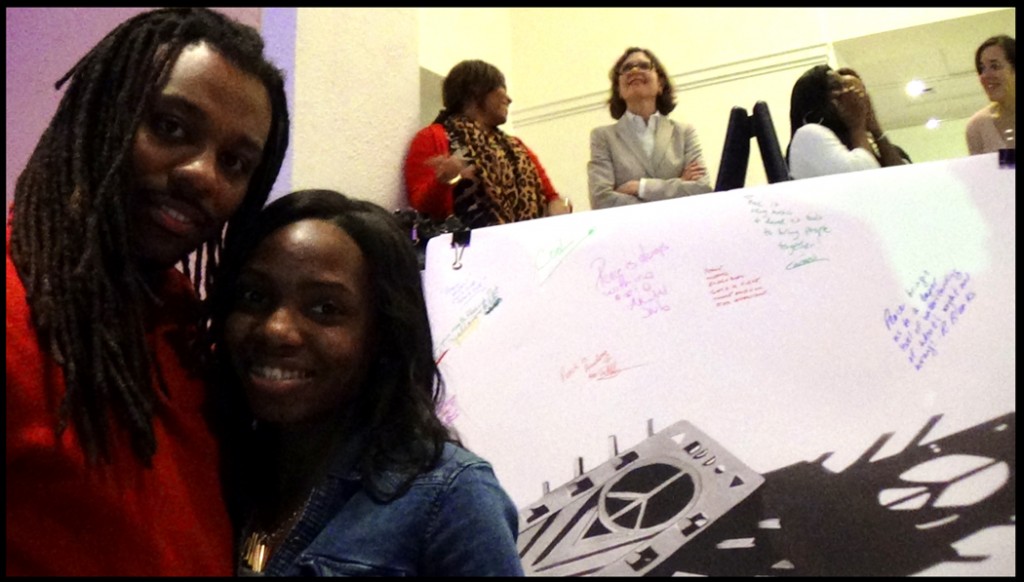
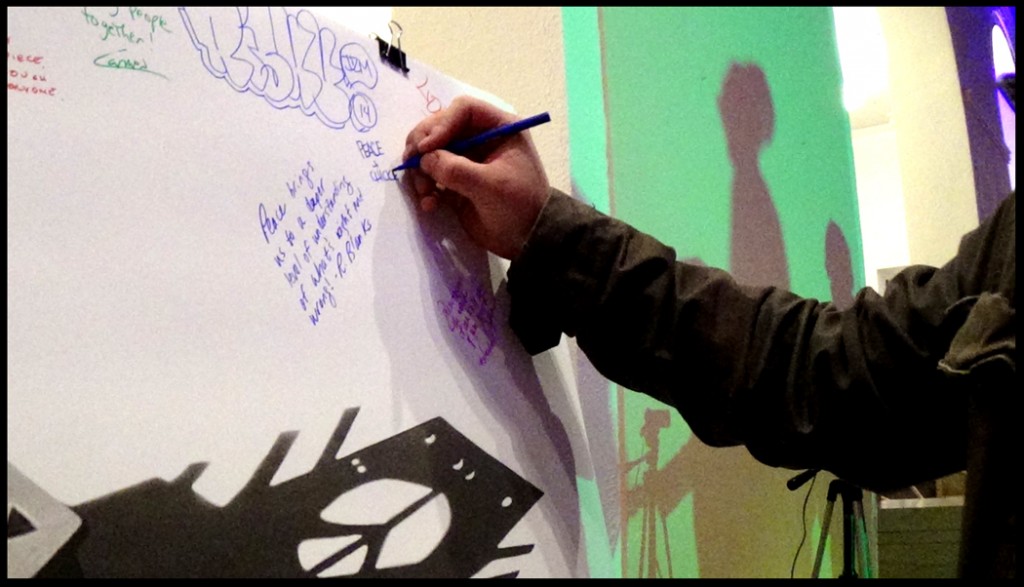
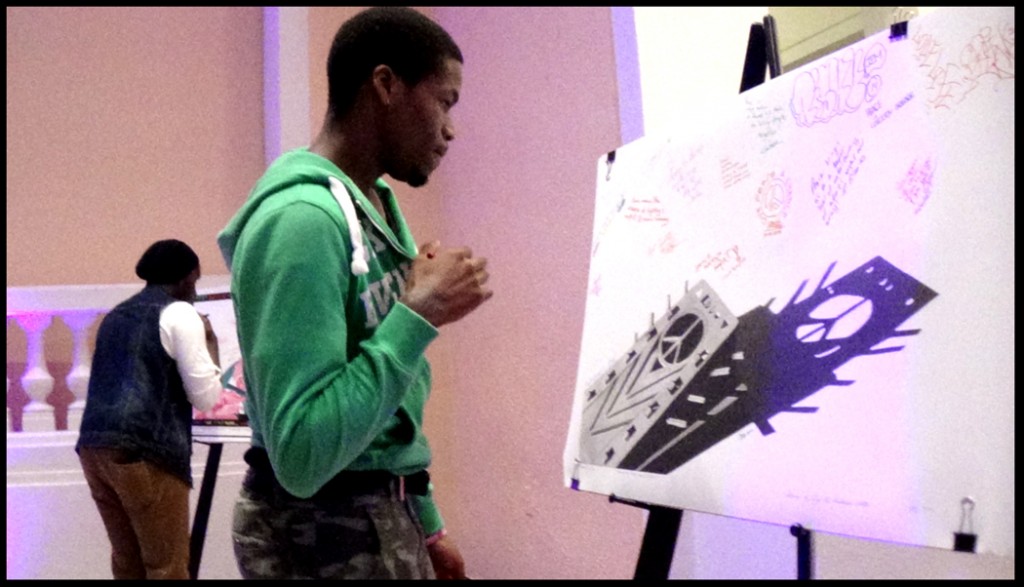
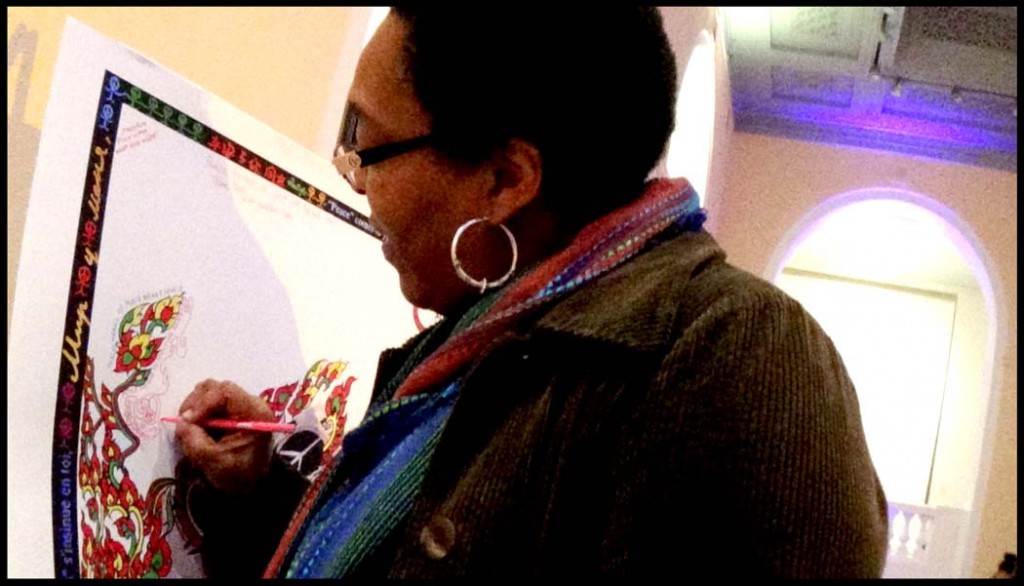
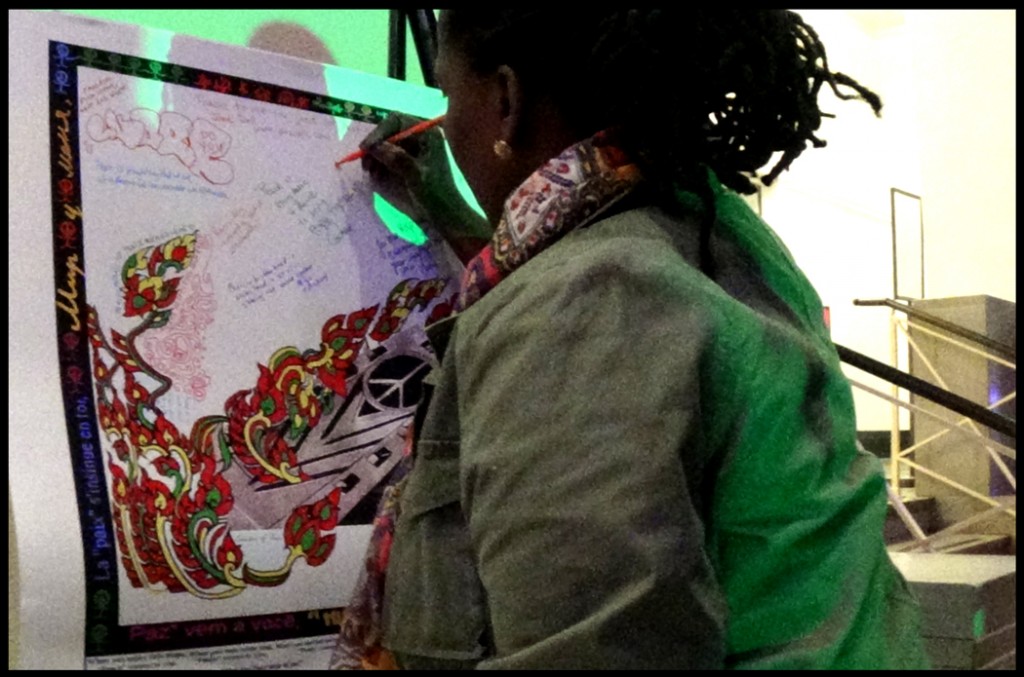
Most of the people were willing to express with their thoughts on peace. Sharing with friends their comments on “What does Peace mean to you?” Some were taking turn to snap photos while writing their peace comments
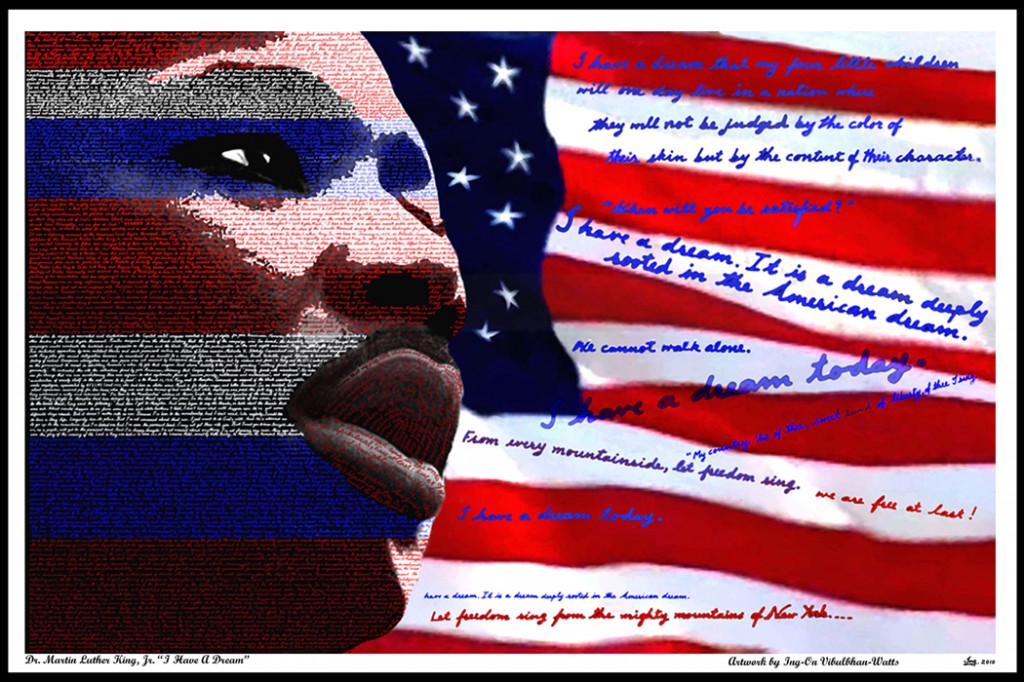
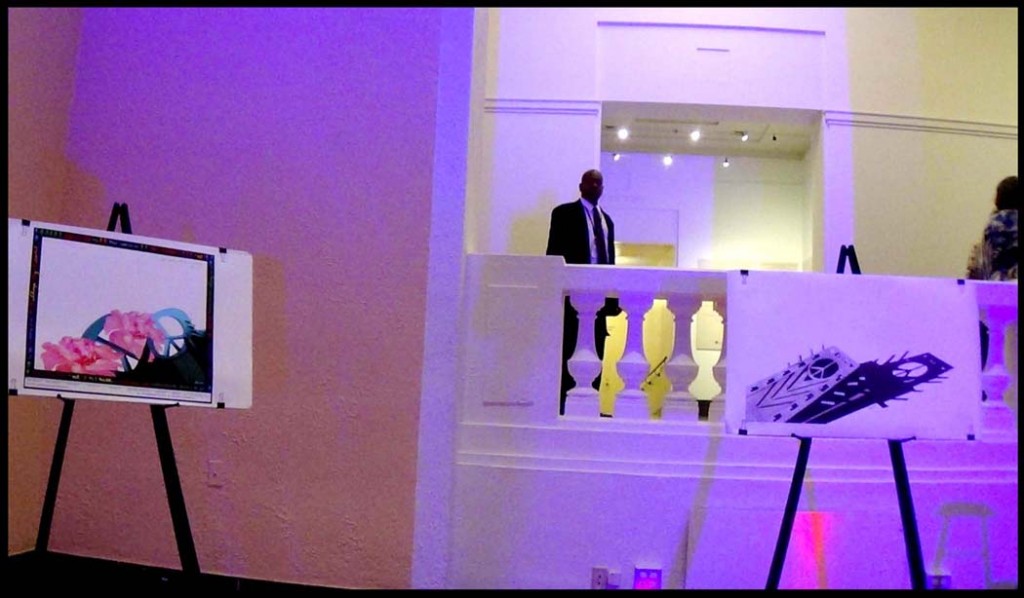
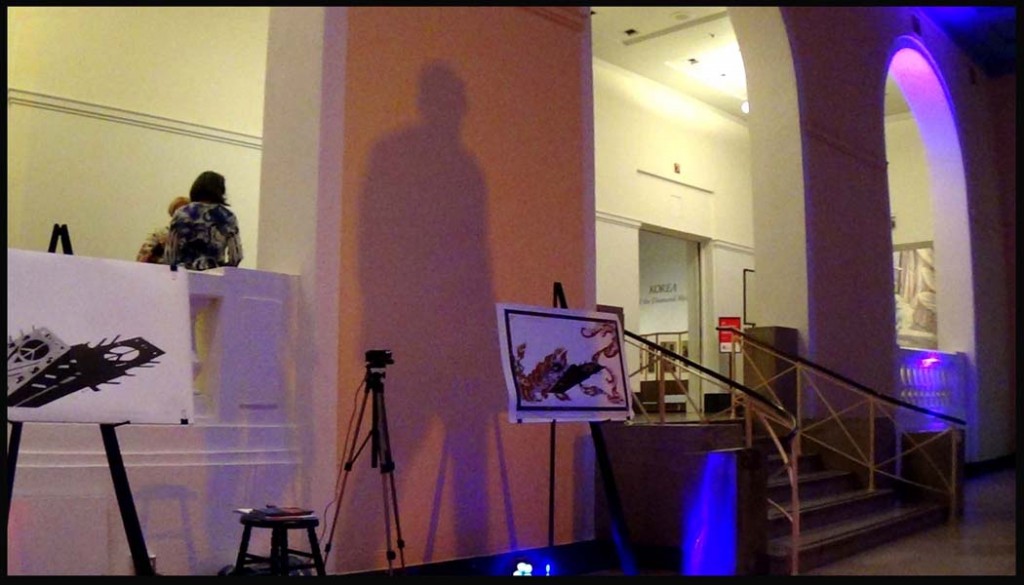
I brought three designs of my Peace Poster and two of my artwork of Gandhi and Dr. Martin Luther King Jr.
Comments on “What does Peace mean to you?”
Comments on “What does Peace mean to you?”
I have to compliment the Newark Museum for arranging this event. The good influence that Newark Museum provided inspired young and old alike to have a good time and a good feeling. People were enjoying the music and dancing with friends and others surrounded by the artwork of the museum. It was nourishment for the mind to see the creative artwork. At the same time people were thinking about peace and then writing down their comments on “What does Peace mean to you?” It was a pleasant time as people got together with positive influences, which is better than hanging around on street corners, drinking, smoking and being tempted by drug dealers.
Institutions such as museums, schools or various government organizations have to provide a positive atmosphere for the population. This is especially true for youngsters who need to be introduced to creative ways of thinking motivating them to do the better.
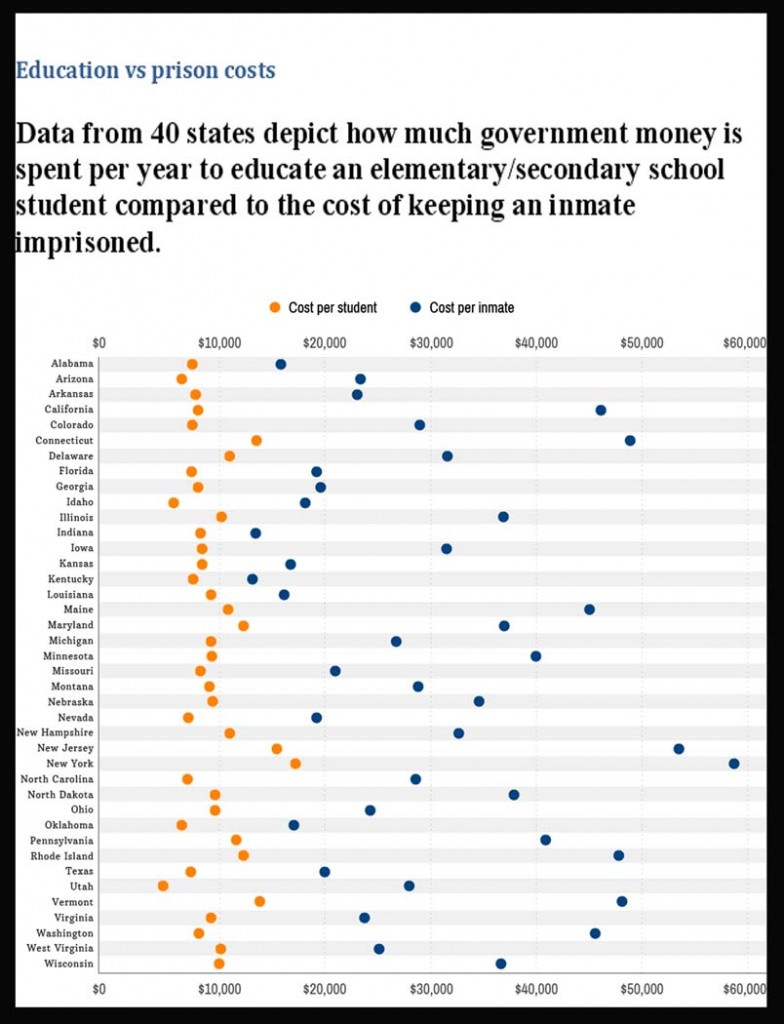
The alternative has often been to incarcerate people at a great financial cost government at all levels. This money could be spent for scholarships to students, especially to low income children. For example in New York the educational cost elementary/secondary school is about twenty thousand dollars, while the cost of incarceration is about sixty thousand dollars per person each year. If there is a healthy environment for youngsters that allow them to go on to become successful in school, they will be able to lead better lives for themselves and society.
We will not have peace if there is still a great difference between the rich and the poor. The inequality in society causes suffering and hardship for the poor. Desperation for survival causes the poor to sometimes be involved in illegal activities which lead to incarceration. With the cutting back of food stamps and education budgets there is less opportunity for the poor and uneducated to survive. We cannot have equality for the poor in a society where the wealth of a nation is not distributed in a more amicable way. We cannot blame the poor and uneducated people if there is lack of programs to help them.
“Angela Davis have argued that prisons in the U.S. have “become venues of profit as well as punishment;” as mass incarceration has increased, the prison system has become more about economic factors than criminality.” The rich corporations benefit from high number of incarceration by subcontracting prison facilities from the government.
Ing-On Vibulbhan-Watts, Monday, October 27, 2014
The following is the research I gathered from the Internet showing the unemployment rate, The Crisis in Black and Brown Youth Unemployment, Education vs. prison costs and Incarceration in the United States:
Credit: NPR
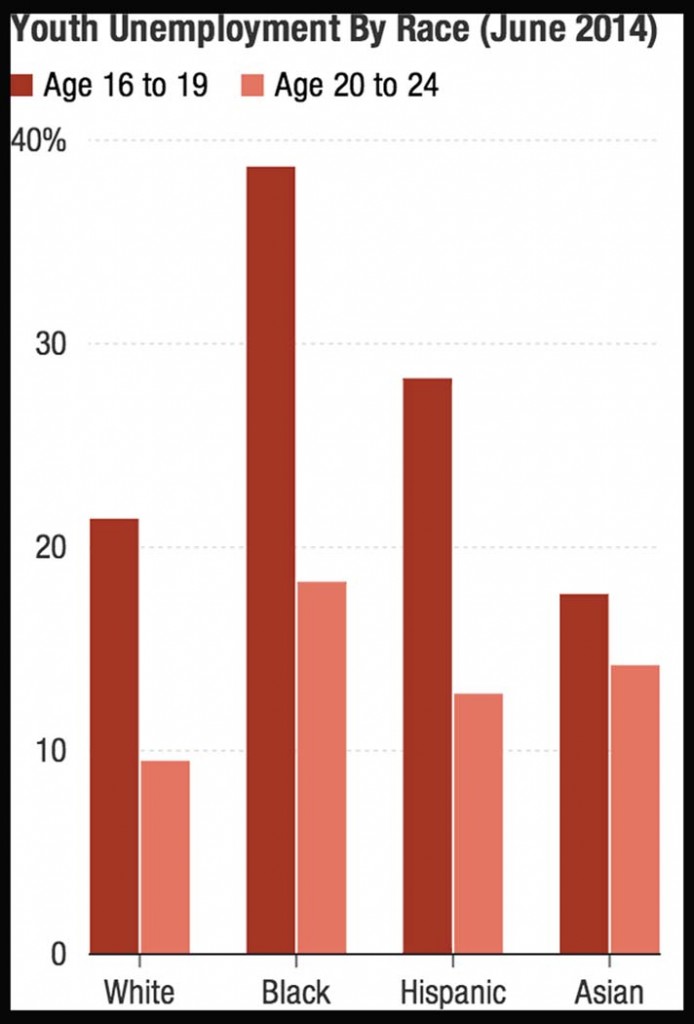
Young people are being chased out of the labor market. Though the national unemployment rate has fallen steadily in recent months, youth unemployment remains stubbornly high, and the jobless rate is even higher among young minorities. For young people between the ages of 16 and 24, unemployment is more than twice the national rate, at 14.2 percent. For African-Americans, that rate jumps to 21.4 percent.
Of course, discrimination could be a factor. But according to William Spriggs, an economist at Howard University, the trend is also being driven by a sluggish economy. As he told Morning Edition’s Renee Montagne, there is still a backlog of Americans who are unemployed or underemployed as a result of the Great Recession, creating more competition for even minimum wage jobs. In a job market where many people with a college education are settling for jobs outside of their fields, a teenager looking for a summer job will find the market crowded.
Another big problem, says Spriggs, is the absence of adequate job information. In most states, companies are not required to publicly list all of their job openings. As a result, there are huge disparities in labor market information, based as much on who you know as what you know.
RACE AND ECONOMIC JUSTICE
WITH IMARA JONES
https://colorlines.com/archives/2014/01/youth_unemployment.html
The Crisis in Black and Brown Youth Unemployment
As the White House prepares to launch a major economic opportunity effort, record high unemployment among black and Latino youth underscores how essential it is to create job opportunities for young people of color.
The critical issue here is that the ages of 16 to 24 are make or break years for lifelong earning potential. With one out four blacks and one out of six Latinos under the age of 25 without work, a generation of youth of color risks falling behind.
The situation for black and Latino unemployed youths is so alarming that leading think tanks and economists are raising red flags about it at a staggering pace. One report on the topic by Demos, the public policy organization, argues that the “exclusion of young people of color” from job opportunities “weakens the promise of America.”*
Why’s that?
With wealth in African-American and Latino communities already the lowest on record, a loss of income on a generational scale would likely harden existing inequities and set back economic progress in the country for decades. That’s because there are simply so many young blacks and Latinos who want work but can’t find it.
The School-to-Prison Pipeline
But there are two additional challenges that magnify black and Latino youth joblessness.
The first is that lower college graduation rates for youth of color puts African-Americans and Latinos at a severe disadvantage. As more workers with higher education compete for jobs that were once dominated by high school graduates, the hill for people of color becomes steeper. That’s because a third less blacks and half as an many Latinos have college degrees as whites. But there’s more at work here.
Disproportionate school discipline directed at blacks and Latinos is a driving force behind lower education attainment rates for these two groups, further damaging lifelong earning potential.
Though students from these communities make up less than four out of 10 of kids in school, they make up seven out of 10 of children “involved in school-related arrests or referrals to law enforcement.” As the Advancement Project points out, students who’ve been suspended are up to five times more likely to not finish high school [PDF]. Given the condition of the labor market, the lack of a high school diploma is simply a non-starter.
The second is the way that higher incarceration rates damage the job prospects of youth of color. With six out 10 individuals in prison black or Latino, over 300,000 people of color are released from incarceration each year [PDF]. As Colorlines editorial director Kai Wright pointed out in a recent article, almost all employers perform a background check on job applicants, even those for low-wage positions. Astoundingly, 90 percent of all African-Americans with criminal records are passed over for employment. That’s a rate a three times higher than whites with a similar history. Skewed incarceration is
another headwind that youth of color face in the job market.
The reason that any of this matters is that youth unemployment means lower incomes and fewer life opportunities for those without work. Since employment between the ages of 16 to 24 is vital to setting the pace for an individuals’ future earning power, joblessness experienced by young people has severe consequences. Just six months of unemployment can mean $45,000 in lower wages. It can take up to a decade to make up lost ground. The longer unemployment lasts, the larger the longterm earnings hole grows. Young people 20 to 24 will lose $20 billion over the next decade in lost wages. Writ large this translates into an amount that will be difficult for black and Latino communities, still reeling from the recession, to absorb.
Turning It Around
The good news is that youth unemployment is entirely fixable. The most important thing is to jumpstart overall job growth and get the economy functioning normally again.
Consequently raising the minimum wage to $10.10 an hour, lowering the wage gap between men and women, and expanding tax breaks for low-income workers—including those without children—would be great places to start. Together these programs would raise the incomes of tens of millions and lift millions more out of poverty. A shot in the arm to the economy on such a scale would help push the labor to function more normally, allow older workers to move up the earnings scale, and clear the way for young people.
But an even more targeted effort to end black and Latino youth unemployment is desperately needed. As Tom Allison, policy analyst at the under-34 advocacy group Young Invicibles puts it, “If the goal is to improve the economy, we have to focus on those who are suffering the most.”
Breaking the school-to-prison pipeline, structuring a way for more people of color to attend college, lowering incarceration rates, and ending employment discrimination for non-violent offenders are all essential.
With an entire generation of black and Latino youth hanging in the balance, the country doesn’t have a second to waste.
Piece has been updated since publication.
Education vs. prison costs
Data from 40 states depict how much government money is spent per year to educate an elementary/secondary school student compared to the cost of keeping an inmate imprisoned.
https://money.cnn.com/infographic/economy/education-vs-prison-costs/
Source: U.S. Census Data and Vera Institute of Justice Graphic: Tal Yellin / CNNMoney
Methodology
Education data was collected by the U.S. Census and covers public school children prekindergarten through twelfth grade. Prison data from the Vera Institute was collected in each state using a department of corrections survey. Corrections departments from 40 states completed and returned the survey, which asked respondents to provide prison expenditures paid by the department of corrections, as well as prison costs paid by other agencies.
Handgun homicides in the United States
The gun control debate has focused on assault rifles – but in many states handguns are responsible for far more deaths.
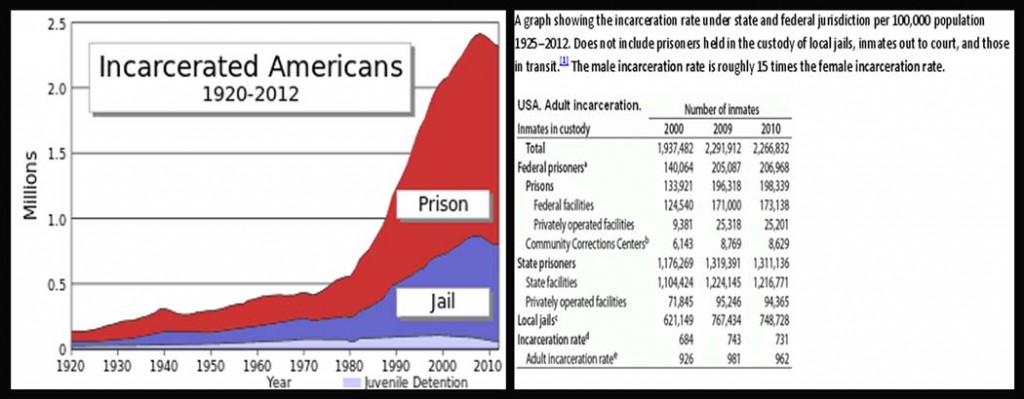 Left: Total incarceration in the United States by year
Right: Inmates held in custody in state or federal prisons or in local jails, December 31, 2000, and 2009–2010.[2]
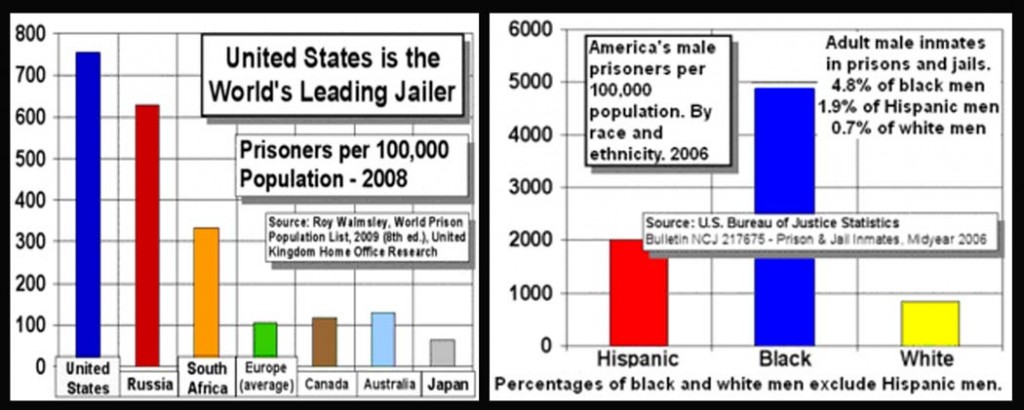
Incarceration in the United States of America is one of the main forms of punishment, rehabilitation, or both for the commission of felony and other offenses. The United States has the highest documented incarceration rate in the world. At year-end 2009, it was 743 adults incarcerated per 100,000 population.[3][4][5][6][7]
Comparison with other countries
See also: Race and crime in the United States and Racial inequality in the American criminal justice system
On June 30, 2006, an estimated 4.8% of black non-Hispanic men were in prison or jail, compared to 1.9% of Hispanic men of any race and 0.7% of white non-Hispanic men. U.S. Bureau of Justice Statistics.[39]
|
Midyear 2010 incarceration rates by race and gender per 100,000 US residents of all ages (adult rates would be higher).[40] |
|||
|
Ethnicity |
Male |
Female |
Total |
| White non-Hispanic | 678 | 91 | – |
| Black non-Hispanic | 4,347 | 260 | – |
| Hispanic of any race | 1,775 | 133 | – |
| All inmates | 1,352 | 126 | 732 |
According to the US Bureau of Justice Statistics (BJS) non-Hispanic blacks accounted for 39.4% of the total prison and jail population in 2009 (841,000 black males and 64,800 black females out of a total of 2,096,300 males and 201,200 females).[41] According to the 2010 census of the US Census Bureau blacks (including Hispanic blacks) comprised 13.6% of the US population.[42][43][44] Of ethnic groups, native Black Americans, Puerto Rican Americans, and American Indians have, by far, some of the highest rates incarceration.[45][46][47][48][49][50][51][52][53] Though, of these groups, the black population is the largest, and therefore make up a very large portion of those incarcerated in US prisons and jails.[54]
Hispanics (of all races) were 20.6% of the total jail and prison population in 2009.[41] Hispanics comprised 16.3% of the US population according to the 2010 US census.[42][55] The Northeast has the highest incarceration rates of Hispanics in the nation.[56] Connecticut has the highest Hispanic-to-White incarceration ratio with 6.6 Hispanic males for every white male. The National Average Hispanic-to-White incarceration ratio is 1.8. Other states with high Hispanic-to-White incarcerations include Massachusetts, Pennsylvania, and New York.[57]
As the Hispanic community is not monolithic, variations are seen in incarceration rates. Among the Hispanic community, Puerto Ricans have the highest incarceration rate. Located primarily in the Northeast and mid-Atlantic states, they are up to six times more likely to be incarcerated than whites, which may explain the higher incarceration rates for Hispanics overall in the Northeast region.[58][59][60][61][62][63][64][65][66] Illegal immigrants, usually Mexican nationals, also make up a substantial number of Hispanics incarcerated.[67][68][69]
In 2010 black non-Hispanic males were incarcerated at the rate of 4,347 inmates per 100,000 U.S. residents of the same race and gender. White males were incarcerated at the rate of 678 inmates per 100,000 U.S. residents. Hispanic males were incarcerated at the rate of 1,755 inmates per 100,000 U.S. residents.[40][70] (For female rates see the table below.) Asian Americans, however, have lower incarceration rates than any other racial group, including whites.[71]
Black majority cities have similar crime statistics for blacks as do cities where majority of population is white. For example, white-majority San Diego has a slightly lower crime rate for blacks than does Atlanta, a city which has black majority in population and city government.[72]
In 2013, by age 18, 30% of black males, 26% of Hispanic males, and 22% of white males have been arrested. By age 23, 49% of black males, 44% of Hispanic males, and 38% of white males have been arrested.[73]
Women
Main article: Incarceration of women in the United States
As of December 31, 2009 the female prison population of federal and state prisons in the United States was 113,462.[74] Within the US, the rate of female incarceration increased fivefold in a two decade span ending in 2001; the increase occurred because of increased prosecutions and convictions of offenses related to recreational drugs, increases in the severities of offenses, and a lack of community sanctions and treatment for women who violate laws.[75] In the United States, authorities began housing women in correctional facilities separate from men in the 1870s.[76]
Youth
|
Census of juveniles in residential placement, 1997–2011.[10][18] |
|||
|
Count |
Male |
Female |
Total |
|
1997 |
90,771 | 14,284 | 105,055 |
|
1999 |
92,985 | 14,508 | 107,493 |
|
2001 |
89,115 | 15,104 | 104,219 |
|
2003 |
81,975 | 14,556 | 96,531 |
|
2006 |
78,998 | 13,723 | 92,721 |
|
2007 |
75,017 | 11,797 | 86,814 |
|
2010 |
61,358 | 9,434 | 70,792 |
|
2011 |
53,079 | 8,344 | 61,423 |
Main article: Youth incarceration in the United States
Through the juvenile courts and the adult criminal justice system, the United States incarcerates more of its youth than any other country in the world, a reflection of the larger trends in incarceration practices in the United States. This has been a source of controversy for a number of reasons, including the overcrowding and violence in youth detention facilities, the prosecution of youths as adults and the long term consequences of incarceration on the individual’s chances for success in adulthood. In 2014, the United Nations Human Rights Committee criticized the United States for about ten judicial abuses, including the mistreatment of juvenile inmates.[77]
According to federal data from 2011, around 40% of the nation’s juvenile inmates are housed in private facilities.[78]
Cost
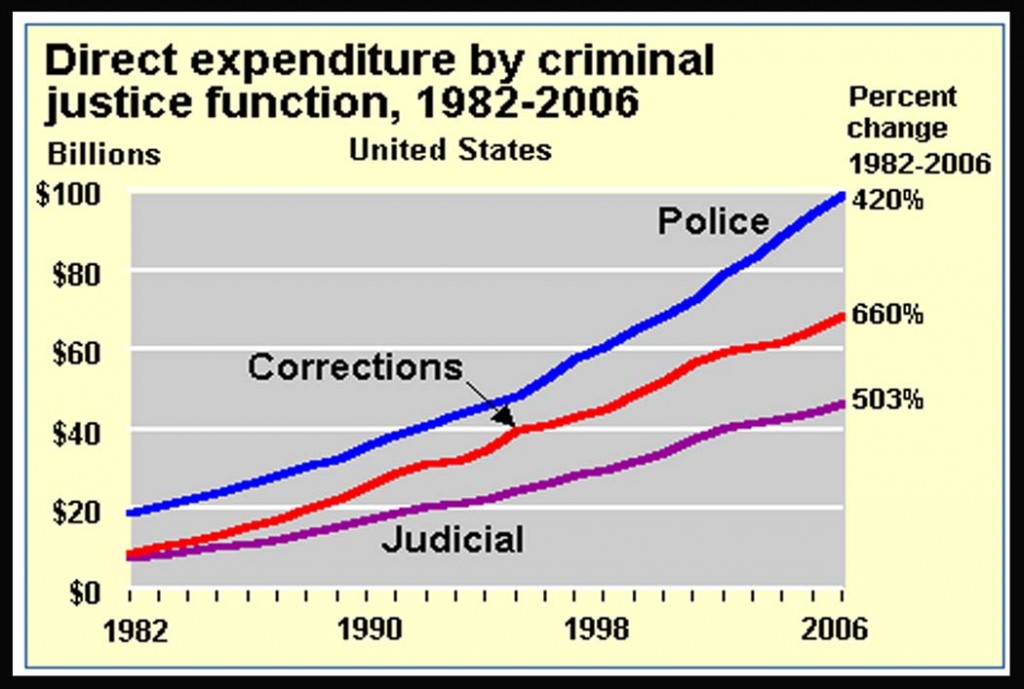
U.S. Bureau of Justice Statistics. Not adjusted for inflation. To view the inflation-adjusted data:[123]
In 2007, around $74 billion was spent on corrections.[123] The total number of inmates in 2007 in federal, state, and local lockups was 2,419,241.[18] That comes to around $30,600 per inmate. Church Publishing estimates the 50 states plus federal government expenditure amounts to $56.9 billion dollars spent on U.S. corrections. The company’s additional 7.5 billion dollar estimate excludes ‘double-counting’ state or federal subsidies for local lock-ups which vary to reach $64.4 billion dollars spent on U.S. corrections annually by 2014.[124]
In 2005, it cost an average of $23,876 dollars per state prisoner. State prison spending varied widely, from $45,000 a year in Rhode Island to $13,000 in Louisiana.[16][121]
In California in 2008, it cost the state an average of $47,102 a year to incarcerate an inmate in a state prison. From 2001 to 2009, the average annual cost increased by about $19,500.[125]
In 2003 among facilities operated by the Federal Bureau of Prisons, it cost $25,327 per inmate.[126]
Housing the approximately 500,000 people in jail in the USA awaiting trial who cannot afford bail costs $9 billion a year.[127] Most jail inmates are petty, nonviolent offenders. Twenty years ago most nonviolent defendants were released on their own recognizance (trusted to show up at trial). Now most are given bail, and most pay a bail bondsman to afford it.[128] 62% of local jail inmates are awaiting trial.[129]
To ease jail overcrowding over 10 counties every year consider building new jails. As an example Lubbock County, Texas has decided to build a $110 million megajail to ease jail overcrowding. Jail costs an average of $60 a day nationally.[128][130] In Broward County, Florida supervised pretrial release costs about $7 a day per person while jail costs $115 a day. The jail system costs a quarter of every county tax dollar in Broward County, and is the single largest expense to the county taxpayer.[131]
Bondsmen have lobbied to cut back local pretrial programs from Texas to California, pushed for legislation in four states limiting pretrial’s resources, and lobbied Congress so that they won’t have to pay the bond if the defendant commits a new crime. Behind them, the bondsmen have powerful special interest group and millions of dollars. Pretrial release agencies have a smattering of public employees and the remnants of their once-thriving programs.
—National Public Radio, January 22, 2010.[131]
The National Association of State Budget Officers reports: “In fiscal 2009, corrections spending represented 3.4 percent of total state spending and 7.2 percent of general fund spending.” They also report: “Some states exclude certain items when reporting corrections expenditures. Twenty-one states wholly or partially excluded juvenile delinquency counseling from their corrections figures and fifteen states wholly or partially excluded spending on juvenile institutions. Seventeen states wholly or partially excluded spending on drug abuse rehabilitation centers and forty-one states wholly or partially excluded spending on institutions for the criminally insane. Twenty-two states wholly or partially excluded aid to local governments for jails. For details, see Table 36.”[132]
As of 2007 the cost of medical care for inmates was growing by 10 percent annually.[16][121]
Criticism
See also: United States incarceration rate § Causes, Torture in the United States § Domestic police and prisons and Human rights in the United States § Prison system
High rates of incarceration may be due to sentence length, which is further driven by many other factors. Shorter sentences may even diminish the criminal culture by possibly reducing re-arrest rates for first-time convicts.[133] The U.S. Congress has ordered federal judges to make imprisonment decisions “recognizing that imprisonment is not an appropriate means of promoting correction and rehabilitation.”[134]
Critics have lambasted the United States for incarcerating a large number of non-violent and victimless offenders;[135][136] half of all persons incarcerated under state jurisdiction are for non-violent offenses, and 20% are incarcerated for drug offenses (in state prisons, federal prison percentages are higher).[41][137] “Human Rights Watch believes the extraordinary rate of incarceration in the United States wreaks havoc on individuals, families and communities, and saps the strength of the nation as a whole.”[135] The population of inmates housed in prisons and jails in the United States exceeds 2 million, with the per capita incarceration population higher than that officially reported by any other country.[121] Criminal justice policy in the United States has also been criticized for a number of other reasons.[138] Critics such as Angela Davis have argued that prisons in the U.S. have “become venues of profit as well as punishment;” as mass incarceration has increased, the prison system has become more about economic factors than criminality.[139] In the 2014 book The Divide: American Injustice in the Age of the Wealth Gap, journalist Matt Taibbi argues that the expanding disparity of wealth and the increasing criminalization of those in poverty have culminated in the U.S. having the largest prison population “in the history of human civilization.”[140]
Reporting at the annual meeting of the American Sociological Association (August 3, 2008), Becky Pettit, associate professor of sociology from the University of Washington and Bryan Sykes, a UW post-doctoral researcher, revealed that the mammoth increase in the United States’s prison population since the 1970s is having profound demographic consequences that affect 1 in 50 Americans. Drawing data from a variety of sources that looked at prison and general populations, the researchers found that the boom in prison population is hiding lowered rates of fertility and increased rates of involuntary migration to rural areas and morbidity that is marked by a greater exposure to and risk of infectious diseases such as tuberculosis and HIV or AIDS.[141]
Guilty plea bargains concluded 97% of all federal cases in 2011.[142]
As of December 2012, two state prison systems segregated prisoners based on their HIV status. On December 21, U.S. District Court Judge Myron Thompson ruled in a lawsuit brought by the American Civil Liberties Union (ACLU) on behalf of several inmates that Alabama’s practice in doing so violated federal disabilities law. He noted the state’s “outdated and unsupported assumptions about HIV and the prison system’s ability to deal with HIV-positive prisoners.” The other state with a similar segregation policy was South Carolina.[143]
Please visit the following links for more information:
Incarceration in the United States
From Wikipedia, the free encyclopedia











































Leave a Reply